
Every week, another agency tells a client to "optimise for AI search." More content. Better schema. Answer-forward writing. The client nods, approves a budget, and three months later asks: is it working?
Most agencies go quiet at that point. Because measuring generative engine optimization is genuinely hard — and most people default to saying "it's difficult to track" before moving on. That's not good enough.
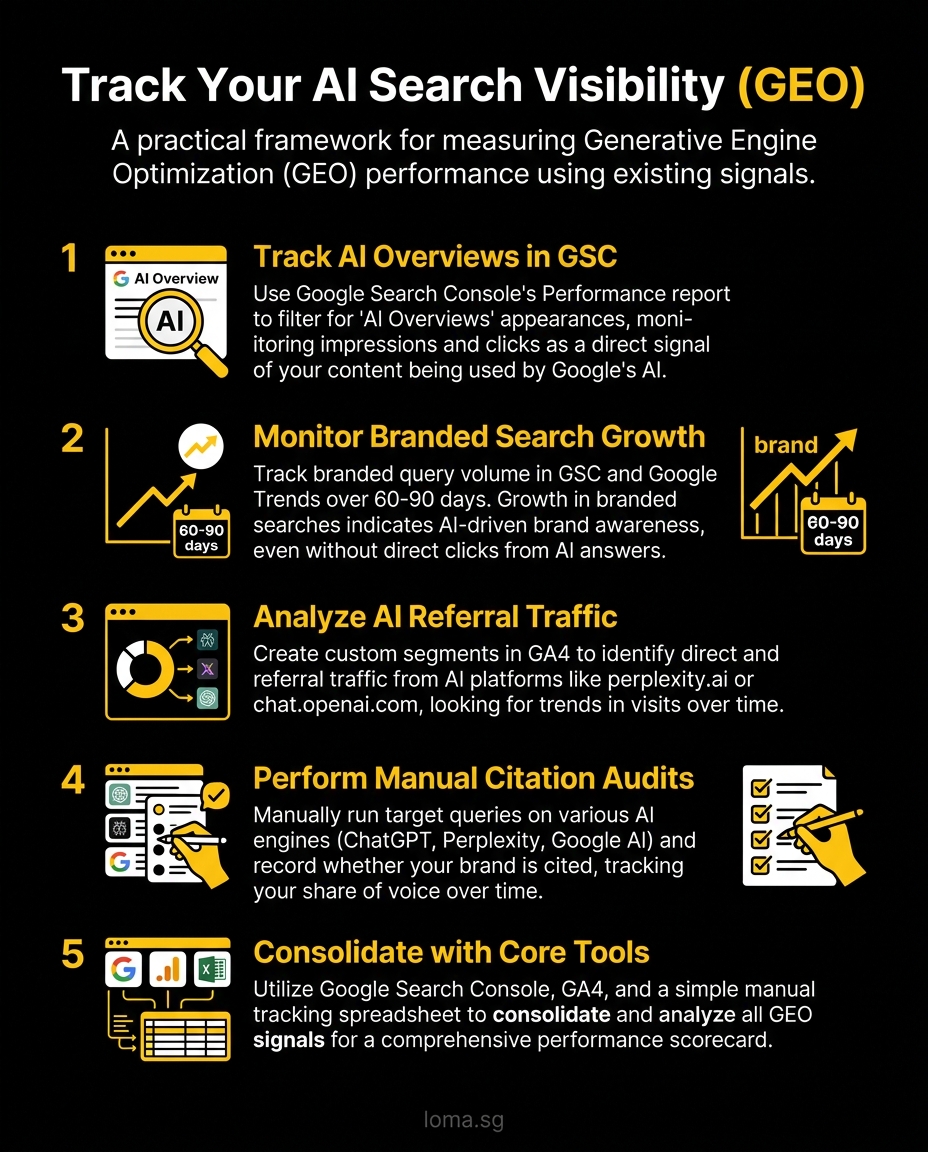
GEO without measurement is just hope. This post gives you a real framework: what signals actually exist, how to pull them, and how to build a scorecard that tells you whether your AI search investment is paying off.
Why Measuring GEO is Hard (And Why Most People Give Up)
Traditional SEO is measurable in a way that spoiled us. Position 3 for a keyword. 4,200 impressions. 12% click-through rate. Clean data, direct causation.
GEO breaks all of that. When ChatGPT answers a user's question about the best digital marketing agency in Singapore, there's no referral click logged in your GA4. No position to track. The citation happens invisibly, and the brand awareness it creates might show up weeks later as a branded search or a direct visit. Maybe.
This is why most brands either don't measure GEO at all, or measure it badly. They watch organic traffic, see no change, and conclude GEO isn't working. What they're actually measuring is the absence of a metric they haven't set up yet.
The solution isn't waiting for a perfect measurement tool. It's using the imperfect signals that exist right now, reading them correctly, and triangulating a picture that's good enough to inform strategy. Here's how.
What You Can Actually Measure: The Four GEO Signals
1. Google AI Overviews Impressions and Clicks
Google Search Console now includes data on AI Overviews appearances, and this is your most reliable direct signal for GEO performance.
To access it: go to Search Console > Performance > Search results. In the filters bar, click Search type (defaults to "Web") and look for appearance type filters. Select "AI Overviews" if your account shows this segmentation. You'll see impressions and clicks attributed to queries where Google featured an AI Overview.
What to watch: impressions trend upward over 30-90 days. Clicks from AI Overviews are lower than traditional blue-link clicks (users often get their answer without clicking), but impressions signal that Google's AI is drawing on your content. A page generating 500 AI Overviews impressions monthly with a 2% CTR is still doing meaningful work.
One caveat: GSC data for AI Overviews is still maturing. Coverage varies by query type, and some accounts see limited segmentation. Pull what you can, and treat it as a leading indicator rather than a definitive measure.
2. Branded Search Volume Growth
This is the most underrated GEO signal. When AI engines cite your brand, people search for you. They might not click through from the AI answer, but they open a new tab and type your brand name into Google.
Track branded query volume in Google Search Console (filter to your brand name and variations) and cross-reference with Google Trends over a rolling 90-day window. If branded searches are growing faster than non-branded, you're building AI-driven awareness that isn't captured in referral data.
This signal has a lag. A ChatGPT citation today might generate a branded search tomorrow, or next week. Treat branded growth as a 60-90 day signal, not a week-to-week metric.
3. Direct and Referral Traffic from AI Platforms
AI engines do send some traffic. Perplexity sends referral clicks that appear in GA4 as perplexity.ai. ChatGPT browsing mode and the web-connected version route traffic through chat.openai.com. Bing's AI answers sometimes generate bing.com/chat or copilot.microsoft.com referrals.
In GA4, create an exploration or a segment filtering for these sources. The list to track:
perplexity.aichat.openai.combing.com/chatcopilot.microsoft.comyou.com
Don't expect huge numbers. Even well-cited brands typically see dozens, not hundreds, of monthly visits from these sources. But the trend matters. If referrals from AI platforms double between Q1 and Q3, that's a meaningful signal even if the absolute number is small.
4. Share of Voice in Manual AI Queries
This is the most labour-intensive signal, but it's also the most direct. Run target queries in ChatGPT, Perplexity, Google, and Claude. Record whether your brand appears in the answer.
This is called a citation audit, and it works like this:
| Query | Platform | Date | Brand Cited (Y/N) | Competitor Cited Instead |
|---|---|---|---|---|
| best digital marketing agency Singapore | ChatGPT | 2026-03-24 | N | Agency A |
| generative engine optimization agency | Perplexity | 2026-03-24 | Y | — |
| AI SEO services Singapore | Google AI | 2026-03-24 | N | Agency B |
| ecommerce development agency Singapore | Claude | 2026-03-24 | Y | — |
| GEO vs SEO difference | ChatGPT | 2026-03-24 | Y | — |
Build a set of 15-20 target queries relevant to your services and run through them weekly (or fortnightly if resources are tight). Your citation rate is the number of times your brand appears divided by total queries. Track it over time.
A 30%+ citation rate on your target query set within six months is a realistic, meaningful benchmark for a well-implemented GEO strategy.
Tools and Setup: Building Your GEO Dashboard
You don't need a specialist platform to start. Three tools cover the fundamentals.
Google Search Console Your primary data source for AI Overviews. The setup is already done if GSC is connected to your site. Focus on:
- Performance > Search results > Filter by AI Overviews appearance
- Export monthly to a spreadsheet, track impressions and CTR week-on-week
- Flag pages with rising AI Overviews impressions — these are your GEO performers
Google Analytics 4 For AI referral traffic, create a custom segment:
- Conditions: Session source matches
perplexity.ai,chat.openai.com,copilot.microsoft.com - Name it "AI Platforms"
- Track monthly sessions, pages per session, and any conversion events
For branded search growth, pull branded query data from GSC and add it to a simple tracking sheet alongside GA4 direct traffic. Rising direct traffic often correlates with AI-driven brand discovery.
Manual Tracking Spreadsheet The citation audit table above. Keep it simple. You're looking for trend over time, not a single data point. After 90 days of weekly tracking, you'll have a clear picture of whether your citation rate is improving, which platforms are citing you, and which queries you're not appearing in (telling you where to focus content).
A note on emerging tools: AthenaHQ, Profound, and Daydream are building dedicated GEO analytics platforms. They offer deeper citation tracking and share-of-voice data across AI engines. As of early 2026, these tools are US-focused, relatively expensive, and not yet optimised for Singapore markets or smaller businesses. If you're a large enterprise with significant budget, they're worth evaluating. For most SMEs, the three-tool setup above is more practical and covers 80% of what you need.
How to Interpret the Signals
Measurement is only useful if you know what improvement looks like. Here's how to read the signals together.
Branded searches growing faster than non-branded means AI is creating awareness. People are hearing about you through AI answers and coming to find you directly. This is a healthy sign even if AI Overviews clicks are flat.
AI Overviews impressions rising with low click-through is acceptable in the early stages. High impressions, low clicks means you're appearing in AI answers but users are getting enough information without visiting your site. This is a visibility win. Over time, the goal is to pull those users deeper into the funnel, which usually requires schema markup and structured content that earns richer citation.
Direct traffic increasing on schema-optimised pages suggests that your schema markup is working. Structured data helps AI engines understand and cite your content more precisely. Pages with schema tend to earn citations that drive branded awareness, showing up in direct traffic uplift.
Citation rate in manual spot-checks below 15% after 90 days signals that either your content isn't structured correctly for AI retrieval, or your authority signals are too weak. Common causes: no FAQ content, no clear entity disambiguation, thin author profiles, no third-party mentions.
Citation rate above 30% on your core query set means GEO is producing real visibility. At this point, shift focus to optimising for conversion: the traffic AI is sending you should be landing on pages that turn awareness into leads.
Building Your 90-Day Baseline and Setting Targets
Don't wait until you feel ready. Run your baseline this week.
Week 1 actions:
- Pull GSC data for the last 90 days, filter for AI Overviews impressions. Note the baseline.
- Pull branded query volume from GSC. Note your current monthly average.
- Check GA4 for AI platform referrals over the last 90 days. Note the baseline (likely near zero at this stage, which is fine).
- Run your first citation audit: 20 queries across ChatGPT, Perplexity, and Google. Record results in the table format above.
Your 3-signal GEO scorecard:
- Signal 1: AI Overviews impressions (target: 20%+ growth over 90 days)
- Signal 2: Branded search volume (target: 15%+ growth over 90 days)
- Signal 3: Citation rate in manual audit (target: 30%+ within 6 months)
Review this scorecard every 30 days. If all three signals are improving, your GEO strategy is working. If one is flat or declining, diagnose the specific problem: content gaps, authority weaknesses, or technical issues with structured data.
The goal is not perfect measurement. It's directional confidence. You should know, within a 90-day window, whether GEO investment is moving the needle or not. The framework above gives you enough signal to make that call.
What This Looks Like in Practice
A LOMA client in professional services started with zero AI Overviews impressions and a 10% citation rate on 20 target queries. At the 90-day mark, after implementing structured content, FAQ schema, and a digital PR campaign targeting industry publications:
- AI Overviews impressions: up from 0 to 340/month
- Branded search volume: up 22%
- Citation rate: 35% across target queries
Those numbers aren't from a single viral piece of content. They're from systematic work on how AI engines understand and cite the brand. The measurement framework made it possible to identify what was working and double down on it.
Build the Measurement Before You Scale the Strategy
Most brands rush into GEO tactics without a measurement baseline. They publish content, add schema, and then have no idea whether anything changed. When it comes time to justify the budget, they can't.
Set up your scorecard now. Run your first citation audit this week. Pull your GSC baseline. Four weeks from now, you'll have enough data to make real decisions.
LOMA builds GEO measurement dashboards as part of every AI SEO engagement. If you want to know whether your content is being cited, talk to our team.